
Imagine that you’ve been working for weeks on several updates for your company’s website. The project’s finally complete. You take a moment to enjoy and bask in the sense of accomplishment, and then, WHAM! Your boss stops by and asks you to provide a report by the end of the week proving that your recent updates improve the site’s usability and effectiveness.
You could freak out, drop all personal appointments on your calendar, camp out at the office, and spend the next few days sleeplessly conducting user tests and gathering results for your report. OR you can take a few minutes to learn more about the system usability scale that is used to evaluate systems like websites and “git-r-done” quickly.
Defining Usability
Since you want to prove better usability for your recent updates, then you’d better dig up a definition of the term usability. The international standard (ISO 9241-11) defines usability as:
The extent to which a product can be used by specified users to achieve specified goals with effectiveness, efficiency, and satisfaction in a specified context of use.
Using this definition is a great way to start off your report or presentation.
Defining Website Usability Scale
Now that you have defined what will be measured, let’s talk about the method that will quickly get you some data – the system usability scale, aka SUS. SUS is a type of Likert scale that is explicitly designed to measure a product’s or website’s usability. When implementing SUS, you ask users a specific series of 10 questions, with responses that range from strongly agree to strongly disagree. The responses are each given a numerical equivalent that are added together to obtain a single SUS score (from 0 to 100) representing usability.
This description will also be helpful in explaining your process in the report or presentation, so feel free to copy this and paste it in place.
A Brief History of the Website Usability Scale (SUS)
If you are unfamiliar with SUS, then it may be helpful to know a bit about the background of this method and where it originated. SUS was developed by John Brooke in 1986 at Digital Equipment Co. Ltd. in Reading, United Kingdom, as part of the usability engineering program. His team needed a process for measuring usability that was quick to implement, effective, and reliable. They started with a pool of 50 questionnaire statements given to 20 people across a range of occupations to use for assessment on two totally disparate software websites (one that was super simple to use and one that was nearly impossible). The results were assessed and a set of 10 statements were selected based on intercorrelations and common responses. You can check out all of the nitty-gritty mathematics and details behind the development of SUS in Brooke’s full documentation. But, the real takeaway is that SUS is a tested and proven usability method that has become the most popular standardized usability questionnaire.
How to Administer SUS
Believe it or not, administering the SUS is the easiest part of the process. The questionnaire statements are already created for you. Here they are:
- I think that I would like to use this website frequently.
- I found the website unnecessarily complex.
- I thought the website was easy to use.
- I think that I would need the support of a technical person to be able to use this website.
- I found the various functions in this website were well integrated.
- I thought there was too much inconsistency in this website.
- I would imagine that most people would learn to use this website very quickly.
- I found the website very cumbersome to use.
- I felt very confident using the website.
- I needed to learn a lot of things before I could get going with this website.
You should not alter these statements in any significant way whatsoever. However, you can replace any words that may cause confusion to the participants. For instance, the word “cumbersome” is often replaced with “awkward”. Other than those minor adjustments, you should not alter the language and/or order of the statements.
Next, you need to determine how you will present the questionnaire to your participants. The easy and most common options are via paper, PDF, and online survey website.
After you’ve prepared the questionnaire, you need to gather a list of people to participate in it. Ideally, these people will have had an opportunity to use the website you are evaluating (even if it’s only for a brief period of 3-5 minutes) but not discussed their opinions with anyone yet. SUS does not require a large group of participants for reliable results. Yes, even asking 5-10 people in your office will work.
Now it’s time to put SUS to work and pull in some data for your report. Deliver the questionnaire to your participants and ask them to record their immediate response to each statement without thinking about them for a long time. If a person feels that they cannot respond to a particular item, they should mark the center point of the scale (neither strongly agreeing nor strongly disagreeing with the statement). When the participants have completed their questionnaires, gather them together for scoring.
How to Score SUS
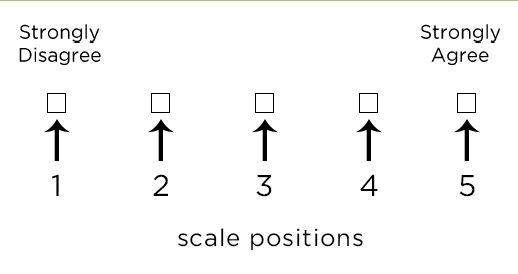
To determine the SUS score, you first need to note the scale position for each statement. Scale position values range from 1 to 5, with “strongly disagree” equating to 1 and “strongly agree: equating to 5. (See diagram.)
Then, you must calculate a score contribution for each statement. For odd-numbered statements (1, 3, 5, 7, 9), the score contribution is equal to the scale position minus 1. For even-numbered statements (2, 4, 6, 8, 10), the score contribution is equal to 5 minus the scale position. Each score contribution will fall within the range of 0 to 4.
Once you have calculated all 10 scores, multiply the sum of the scores by 2.5, which will produce the overall website usability value. This value will range from 0 to 100.
Here is a sample SUS that has been scored:
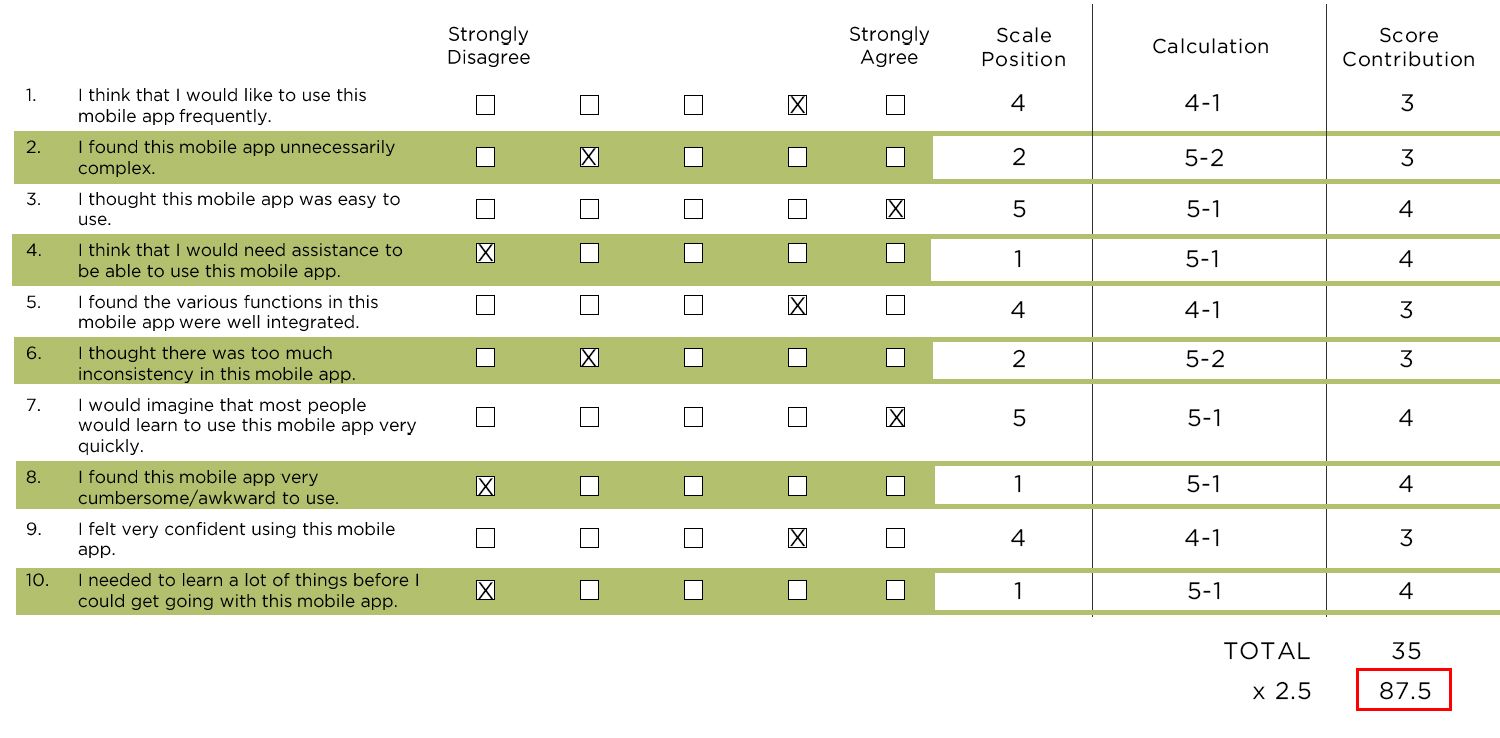
You should average the website usability values of all participants to obtain your overall website usability value.
How to Analyze SUS
Now that you have your SUS score, it’s time to talk about what the score means. Even though the score will always range between 0 and 100, you must resist the urge to call it a percentage. It is not a percentage; it is actually a percentile ranking. Remember back in school when the teacher graded on a bell curve? Yep. This is the same thing.
If you don’t want to do the math to calculate a true percentile ranking, then you can go by this rule of thumb: An SUS score of 68 is average. So, any score above 68 is above average, and any score below 68 is below average. Hopefully, your score is well above 68, so you can report a high usability score.
Make sure you clearly communicate to your boss and anyone else who views your report that the SUS score does NOT equate to a percentage.
Pros of SUS
There are many reasons why SUS is the most popular standardized usability questionnaire. Here are a few:
- SUS is inexpensive. In fact, the website itself is non-proprietary (no license needed) and totally free. The only cost is your time spent preparing, conducting, and analyzing the questionnaire. (You may incur costs if you choose to use an online survey website to administer the questionnaire.)
- SUS is easy to administer. There are only 10 questions, and they’re pre-written. And, you can choose to collect responses in the way that is easiest for you (paper, PDF form, online survey).
- SUS questionnaires are easy for participants to complete. With only one instruction and a fairly simple structure for responses, participants can quickly understand what to do and finish an SUS questionnaire in a matter of minutes.
- SUS produces quick results. You can easily prep, conduct, analyze, and report on an SUS study in a matter of hours.
- SUS is technology agnostic. You can determine usability for a wide range of products, not just technology-based products, using SUS.
- SUS provides single-score results. Having one score to analyze makes reporting extremely simple.
Cons of SUS
As with any system, SUS does have some drawbacks. Here’s a list of the most commonly cited ones:
- SUS scoring is a bit tricky, which can lead to calculation errors. You can easily avoid this by using a scoring sheet that automatically calculates scores.
- SUS scores can be misinterpreted as percentages, which they are NOT. This is why you should clearly explain the score and even offer up a comparable grade for the people you share the scores with, so they do not draw their own conclusions. See Brooke’s SUS: A Retrospective for more info on scoring.
- SUS is not a diagnostic tool. It cannot tell you which piece of your product causes high or low levels of usability. It only gives one score that represents the product’s overall usability. If your SUS results in a low usability score, you will need to conduct further research to pinpoint the problem areas.
When & Where You Should Use SUS
You should consider SUS for your UX research when you are looking for a quick assessment of a product’s usability. Since SUS can be used on practically any product, it’s a good option when other research methods are projected to return scores with low confidence or may be skewed based on technological challenges.
SUS results get even better when you implement an SUS at each revision round, thus providing you with scores that can be compared while progress is being made to ensure that changes are improving the product.
SUS can be administered in many different scenarios and return valid results for both in-person and remote situations.
When & Where You Should NOT Use SUS
Even though SUS is highly reliable, there are scenarios when you should not use it for your UX research. The most common scenario is when you are interested in obtaining feedback about specific components of a product. If you need to know if the new dropdown menu is working for users, SUS cannot deliver that data. Again, SUS only provides an overall usability score for a product.
Conclusion
As you can tell, there is certainly a right place and right time for SUS. In our scenario, it most certainly was the right place and time, because we had just a few days to conduct usability research and provide a report for the executive team.
Even though there are limitations around the depth of usability information SUS can provide, it’s still a widely used and accepted UX research method. This is primarily because it’s easy to administer and has long provided valid, reliable results across many thousands of studies.
Please feel free to download and use any of the SUS tools we’ve made available, and reach out to us if questions arise as you are conducting your own SUS studies.
References & Further Reading on Website Usability Scale
- Website Usability Scale (SUS) – Usability.gov
- Measuring Usability With the Website Usability Scale
- The Factor Structure of the Website Usability Scale
- Can You Use the SUS for Websites?
- SUS: A Retrospective
- Determining What Individual SUS Scores Mean: Adding an Adjective Rating Scale
- SUStified? Little Known Website Usability Scale Facts
- Measuring the User Experience
- Smart Phone Applications for People With Brain Injury